Directors' report
Business review - Key performance indicators
We believe that these key performance indicators are significant in managing the challenges we face and
demonstrate how the business is performing and developing.
See the text version of the Key performance indicators
*This page uses JavaScript.
Financial performance
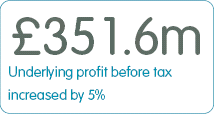
| Underlying profit before tax* | Expand |
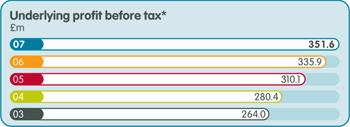
Improvements in this measure demonstrate successful delivery of our strategy. The measure identifies the amount of income after expenditure that the Group has earned for its shareholders during the year. |
|
| Net interest margin | Expand |
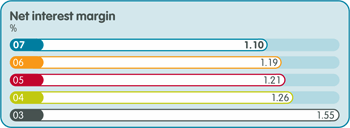
Measures the difference between the interest rate we earn on our assets, loans to customers and other banks, and the interest rate we pay to our savers and on funding raised in the wholesale markets. Net interest is a major component of profit and is monitored closely as it is a strong guide to our profitability. |
|
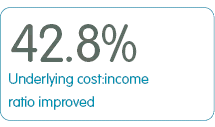
| Underlying cost:income ratio* | Expand |
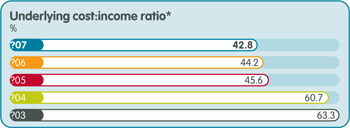
The efficiency of the Group and ability to manage expenditure below the level of income is important. This ratio shows underlying costs as a proportion of our income. |
|
| Underlying earnings per share* | Expand |
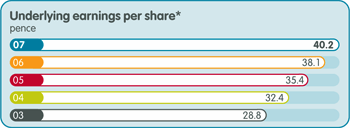
This shows the level of income available to each of our issued shares after deducting underlying expenses and tax costs. This ratio is a key factor in determining the value of shares and, in aggregate, the value of the Group. |
|
| Underlying return on equity* | Expand |
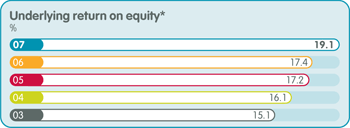
This measure is frequently used by investors and analysts to assess the effectiveness of the business in generating earnings. It is calculated by taking the Group's underlying profit after tax, expressed as a proportion of the average shareholder equity deployed in the business during the year, to earn that return. |
|
| Tier 1 capital ratio | Expand |
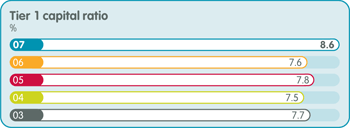
Capital is essential to a bank as protection against the cost of unforeseen events and, as such, ensures we are able to provide a secure home for our savings deposits. Therefore, the Board closely monitors the amount of capital available. The Financial Services Authority, our regulator, also uses the amount of available capital as a key determinant of the capacity of a bank to operate legitimately. "Tier 1" is the highest form of capital and must be at least half of the total capital of a bank. |
|
| Indexed loan-to-value of total portfolio | Expand |
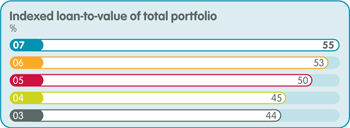
This ratio is important as it gives comfort on the level of equity in the properties owned by our customers as security for our mortgage portfolio. It represents, across our whole mortgage portfolio, the average value of the mortgage outstanding on each property, compared to an estimate of the property's value. This estimate takes into account regional property inflation statistics, from the time of loan origination to the end of the year shown. |
|
| Funding mix | Expand |
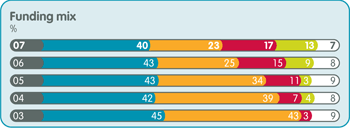
We raise finance from a number of different sources to enable us to provide mortgages. It is important that these sources are diversified and varied in order to minimise the costs and the risk of over-dependence on any one source. This measure shows the type and amounts of funding relative to each other.
|
|
| Asset mix | Expand |
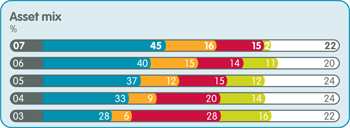
Different types of asset have differing risk and margin characteristics. We review the proportions of these different assets to ensure the balance sheet remains strong and sustainable.
|
|
| Market share of net new mortgage lending | Expand |
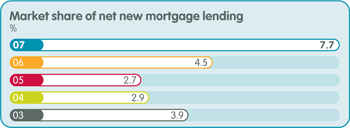
This measure is the level of our net new mortgage lending compared to the whole market during the year. Net lending is very important as it measures the increase in size of the lending balances, which in turn is one of the key drivers of our income. |
|
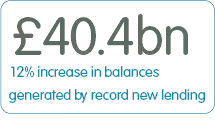
| Lending balances | Expand |
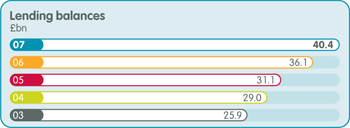
The total amount of lending balances outstanding at the end of the year is important as increases in lending balances generate increases in income. |
|
| Savings balances | Expand |
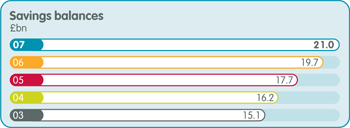
Retail savings balances form an important part of how we fund the business, enabling us to provide mortgages to our customers. This measure shows total savings balances at the end of the year. These balances are generated through our savings products which are distributed via our retail, online, telephone, and offshore channels, and in partnership with other organisations. |
|
* A reconciliation of underlying profit before tax to the statutory measure profit before tax is provided in the summary income table. Figures relating to 2003 are on a UK GAAP basis and 2004-7 are on an IFRS basis.
Non-financial measures
| Staff satisfaction score | Expand |
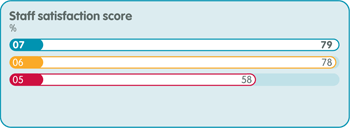
The morale and motivation of our people is vitally important to the success of the Group. We regularly undertake surveys to measure these factors. The findings of these surveys are used to identify improvements to the workplace and the environment in which our people work. |
|
| Customer satisfaction score | Expand |
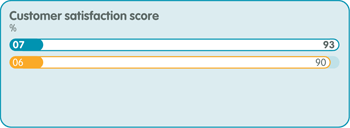
We regularly ask our customers, by survey as well as through other means, to express their satisfaction with our products and services. The results of the surveys are used to identify ways in which we can improve our proposition to our customers, generating better value for them and shareholders alike. |
|
